LLM API Failover: Building Multi-Model High Availability
Why single-vendor AI APIs are a reliability liability
If your service calls one AI provider, your availability ceiling is that provider's SLA. OpenAI and Anthropic both publish 99.9% uptime commitments — which translates to roughly 43 minutes of acceptable downtime per month. That's the ceiling, not the floor.
The real picture is worse. Rate limiting during peak hours, regional outages, and response anomalies introduced by model version rollouts typically don't appear in official incident reports. When GPT-5.5 launched in early 2026, 503 error rates exceeded 5% during certain windows. Claude Opus 4.8's inference latency has spiked past 30 seconds under heavy load. For consumer-facing products, that's a blank screen or an error page — and it costs you retention.
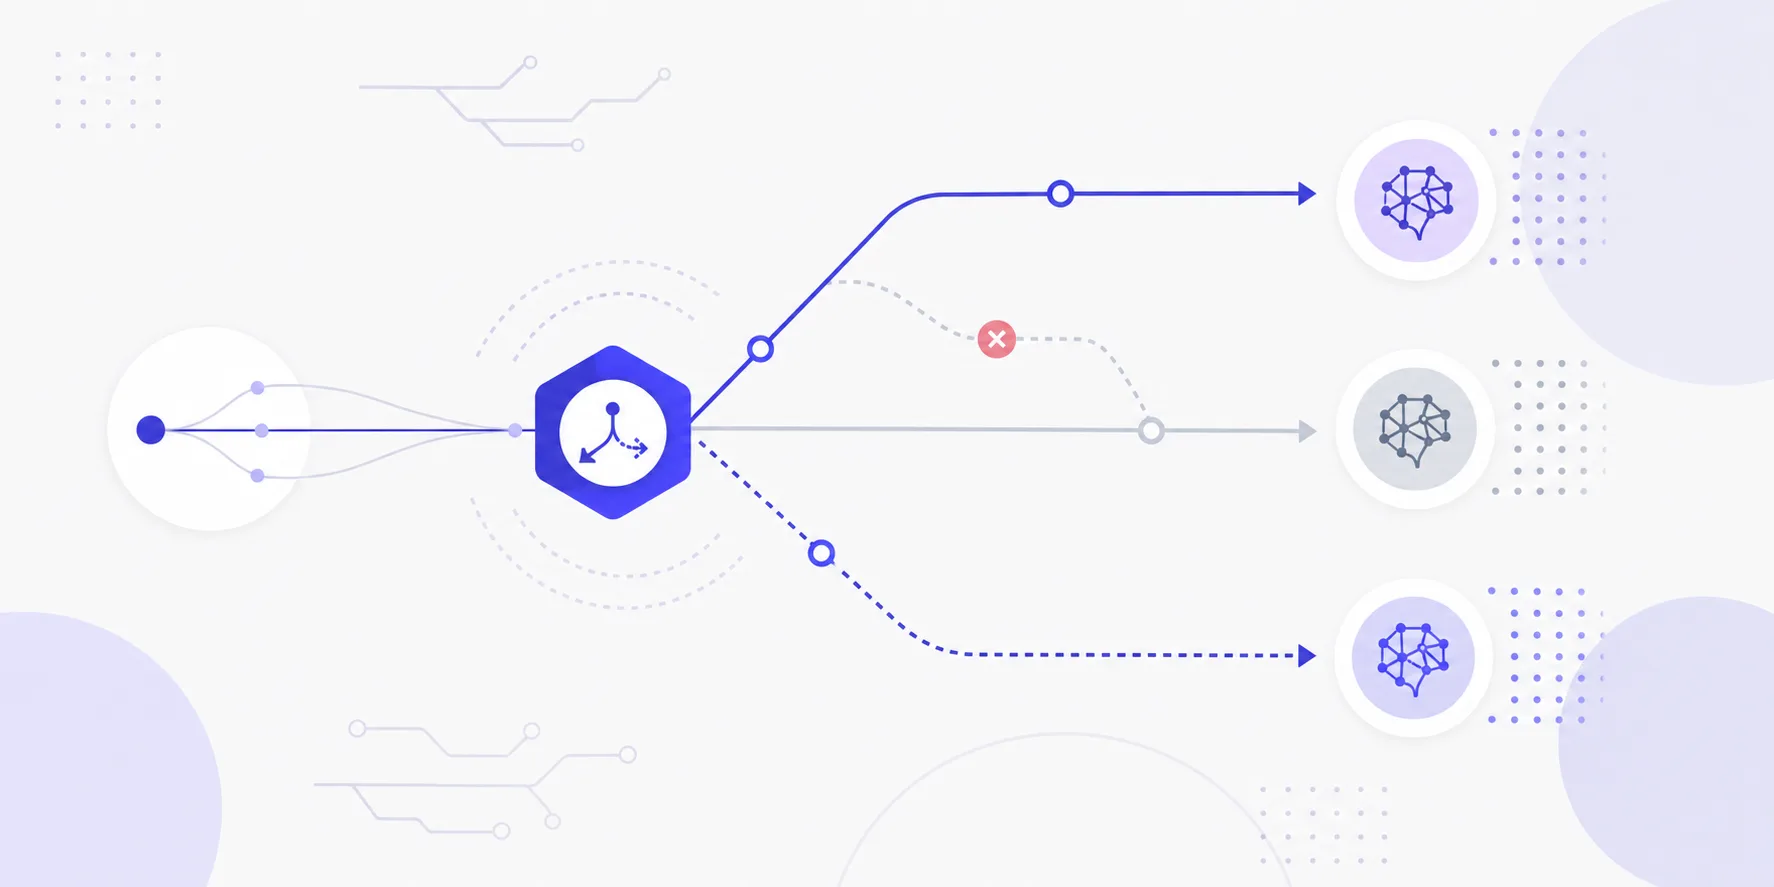
The answer isn't switching providers. It's building an LLM API failover layer that routes requests across multiple models, cuts over silently when the primary is unhealthy, and pushes your effective availability above 99.95%.
Health checks: three things you actually need to measure
A health check for an LLM API is not a port ping. You need to track three independent signals:
Connectivity
Send a minimal probe request every 10–15 seconds — something like a "ping" prompt with max_tokens=1. You're only checking the HTTP status code. Target latency under 500ms; anything that times out gets marked degraded immediately.
Error rate
Use a sliding window over the last 60 requests and track the ratio of 5xx and 429 responses. Reasonable thresholds:
- degraded: error rate > 10%
- unhealthy: error rate > 30%
P95 latency Track P95 response time over the last 100 requests. For conversational apps, 8 seconds is a reasonable soft threshold. For streaming, focus on time-to-first-token (TTFT) — 3 seconds is a good ceiling.
Each dimension scores independently. Any single threshold breach drops that model's routing weight or pulls it from the pool entirely.
from dataclasses import dataclass, field
from collections import deque

@dataclass
class ModelHealth:
    model_id: str
    error_window: deque = field(default_factory=lambda: deque(maxlen=60))
    latency_window: deque = field(default_factory=lambda: deque(maxlen=100))
    last_probe: float = 0.0
    status: str = "healthy"  # healthy | degraded | unhealthy

    def record(self, success: bool, latency_ms: float):
        self.error_window.append(0 if success else 1)
        self.latency_window.append(latency_ms)
        self._update_status()

    def _update_status(self):
        if len(self.error_window) < 10:
            return
        error_rate = sum(self.error_window) / len(self.error_window)
        p95 = sorted(self.latency_window)[int(len(self.latency_window) * 0.95)]
        if error_rate > 0.30 or p95 > 8000:
            self.status = "unhealthy"
        elif error_rate > 0.10 or p95 > 3000:
            self.status = "degraded"
        else:
            self.status = "healthy"
Circuit breaker + priority queue: the routing core
Health checks give you state. The circuit breaker decides what to do with it. The classic three-state model:
| State | Meaning | Behavior |
|---|---|---|
| Closed | Normal | All requests pass through |
| Open | Failing | Requests are immediately rerouted; the model is not called |
| Half-Open | Recovering | A small sample (e.g., 10%) passes through to verify recovery |
Set the Open state duration to 30–60 seconds. Too short and you'll trigger thrashing during an unstable period — repeated failover switches that compound into a cascade.
The priority queue defines your model preference order. A typical production config:
model_pool:
  - id: claude-opus-4.8
    priority: 1
    weight: 100
    capabilities: [reasoning, long_context]

  - id: gpt-5.5
    priority: 2
    weight: 80
    capabilities: [reasoning, function_calling]

  - id: deepseek-v3
    priority: 3
    weight: 60
    capabilities: [reasoning, coding]

  - id: gpt-5.4-mini
    priority: 4
    weight: 40
    capabilities: [fast_response]
    role: emergency_fallback
The router walks the list by priority, skips any model with an Open circuit, and picks the first Closed or Half-Open model. If a request carries a capability tag like long_context, models that don't support it are filtered out before selection.
When a failover triggers, don't silently drop the original request — push it into a retry queue and fire an async alert. A single Slack or PagerDuty webhook message is enough. Include: the failing model, current error rate, the fallback target, and a timestamp.
The details that make failover actually seamless
Two problems come up constantly in production that most writeups skip.
Context format compatibility
OpenAI, Anthropic, and DeepSeek don't share identical message formats. Claude's system prompt placement and role field handling diverge from the OpenAI-compatible format in subtle ways. Tool calling schemas diverge even more. You cannot pass a raw OpenAI payload directly to Claude and expect it to work.
The clean solution: standardize on OpenAI message format internally, and have each model adapter convert to the target format at the edge. This keeps the routing layer format-agnostic and lets you test adapters in isolation.
Cost visibility
Fallback models may be more expensive than your primary, or cheaper but lower quality. Either way, you need visibility. Declare a cost_tier on each model in your config, then track which requests hit fallback paths. Set a daily budget alert — if fallback models account for more than 20% of your token spend on any given day, that's worth a notification.
The most useful single metric here is fallback rate: the percentage of requests routed to a non-primary model in the last hour. Under normal conditions this should be below 1%. If it crosses 5%, automation isn't enough — something is persistently wrong with your primary and it needs human attention.
Production deployment checklist
A few things that are easy to overlook when you go to ship this:
- Probe requests cost tokens. Four probes per minute per model adds up fast — easily hundreds of thousands of tokens per month across your pool. Use the shortest possible prompt and set
max_tokensto 1. - Don't run health checks synchronously in the request path. Health state should be maintained by a background async task or goroutine. Incoming requests read cached status; they don't wait for a live check.
- Coding CLI tools need transparent proxy support. Tools like Claude Code, Codex, and Gemini CLI read API keys from environment variables and talk to provider URLs directly. Your failover layer needs to expose compatible endpoints so these tools think they're hitting the official API — the switchover should be invisible to them.
- Structure your logs. Every call log should include at minimum:
model_id,latency_ms,success,fallback_triggered. You'll want this when you're trying to identify which model is your most frequent failure point over a rolling 30-day window.
In a Kubernetes environment, run the routing layer as a dedicated sidecar or standalone microservice. Share health state via Redis across replicas — if each pod maintains its own independent view, you'll get inconsistent routing decisions when the pool scales horizontally.
A practical shortcut if you don't want to build this yourself
This infrastructure is real work. The health check system, the circuit breaker, the adapter layer, the format normalization — it's several weeks of engineering before you have something production-ready.
I use XycAi as the routing layer for my own projects. It exposes a single OpenAI-compatible endpoint across 200+ models, handles Claude Code, Codex, and Gemini CLI with one-command setup, and runs on global CN2 nodes with around 5ms direct-connect latency. GPT and Claude official models are available at roughly 14% of list price. For a small team, the tradeoff is straightforward: hand the multi-model routing and latency problem to a platform that's already solved it, and spend your engineering time on the product.
One API for 200+ global AI models
GPT · Claude · Gemini official models from 14% of list price. Licensed LLM filing, CN2 direct connect at ~5ms, compliant global invoicing.
Try XycAi →